Present and Probable Market Directon
27 Mar 2025
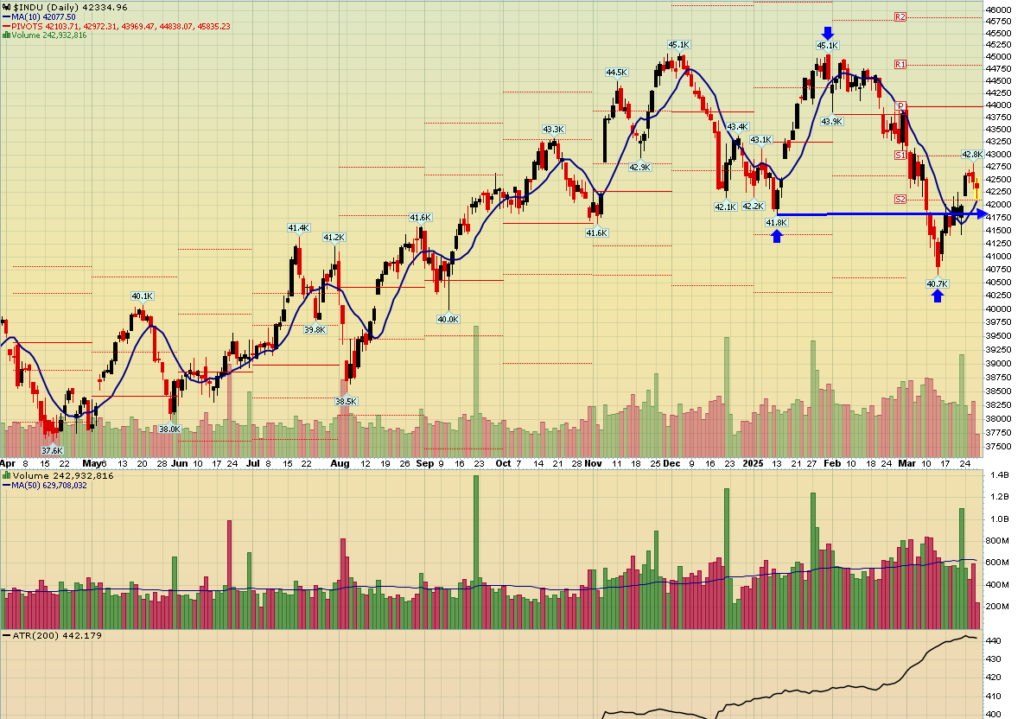
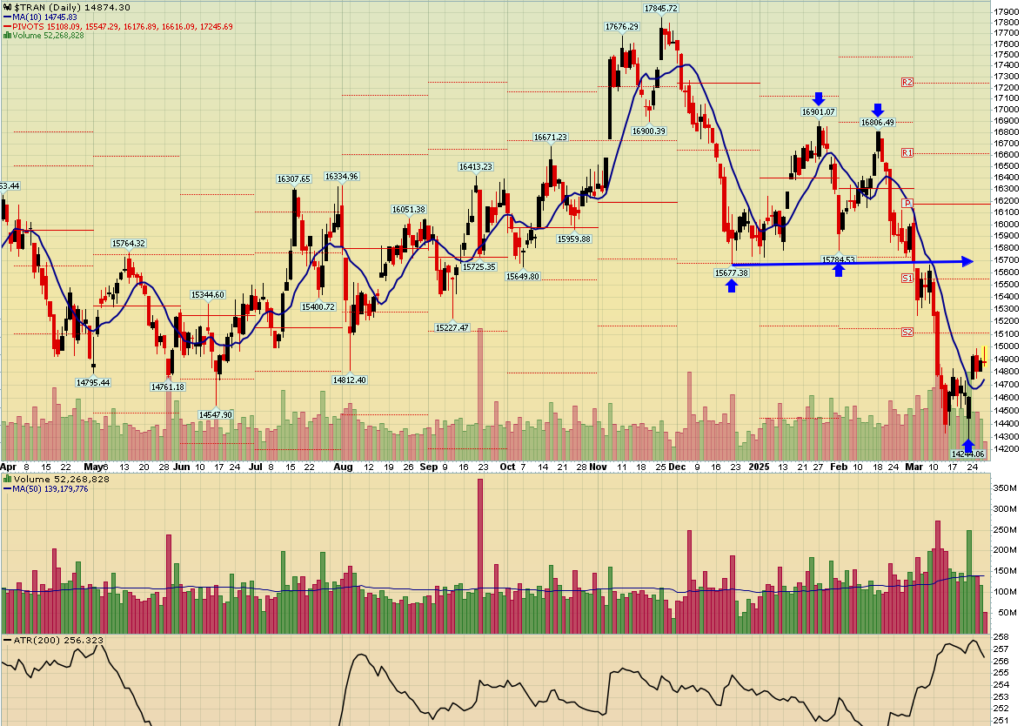
Both the Dow Jones Industrial Average and the Dow Jones Transportation Average have formed interemediate term bottoms. What this means is there has been a temporary stop in selling pressure for both averages. Both averages must confirm each other to establish a trend and the direction of the trend. At this time the primary trend is still down and selling has taken a breather. Both averages would have to breach their preceding intermediate tops to indicat a reversal of trend and the beginning of a new uptrend.
The daily chart of The Dow Jones Industrial Average follows:

The daily chart of the Dow Jones Transportation Average follows

Charts are courtesy of stockcharts.com


